
GCP Cloud monitoring provides visibility into the performance, availability, and overall health of cloud-based applications. Cloud Monitoring collects metrics, events, and metadata from Google Cloud, Amazon Web Services, hosted availability probes, application metrics, and various common application components including Cassandra, Nginx, Apache Web Server, Elasticsearch, and many more.

Cloud monitoring ingests this data and generates insights through dashboards, charts, and alerts. Cloud Monitoring Alerts helps us collaborate by integrating with Slack, PagerDuty, HipChat, Campfire, and more.
Here we will be monitoring a Compute Engine virtual machine (VM) instance with Cloud Monitoring. We will also install monitoring and logging agents for our virtual machine to collect additional information from our instance, which may include third-party metrics and logs. application.
Now let’s go step by step to implement the cloud monitoring approach.
Create a Compute Engine instance
- In the Cloud Console dashboard, go to Navigation menu > Compute Engine > VM instances, then click Create instance.
- Fill in the fields as follows, leaving all other fields at the default value:
Name: monitor-instance
Region: us-central1
Zone: us-central1-a
Series: N1Machine
type: n1-standard-2
Boot disk: Click Change. Select version Debian GNU/Linux 11 for Debian OS and click Select.
Firewall: check Allow HTTP traffic
3. Click Create.
Add Apache2 HTTP Server to instance
- In the Console, click SSH to open a terminal to instance.

- Click Connect.
- Run the following commands in the SSH window to set up Apache2 HTTP Server:
$ sudo apt-get update
$ sudo apt-get install -y apache2 php7.0
$ sudo service apache2 restart
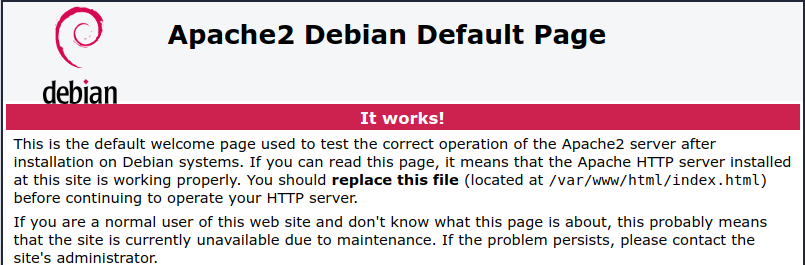
3. Return to the Cloud Console, on the VM instances page. Click the External IP for moniter-instance instance to see the Apache2 default page for this instance like this.
Create a Monitoring Metrics Scope
Set up a Monitoring Metrics Scope that’s tied to our Google Cloud Project. The following steps create a new account that has a free trial of Monitoring.
- In the Cloud Console, click the Navigation menu > Monitoring.
When the Monitoring Overview page opens, the metrics scope project is ready.
Install the Ops agents
The Ops Agent collects logs and metrics on Compute Engine instances, sending logs to Cloud Logging and metrics to Cloud Monitoring.
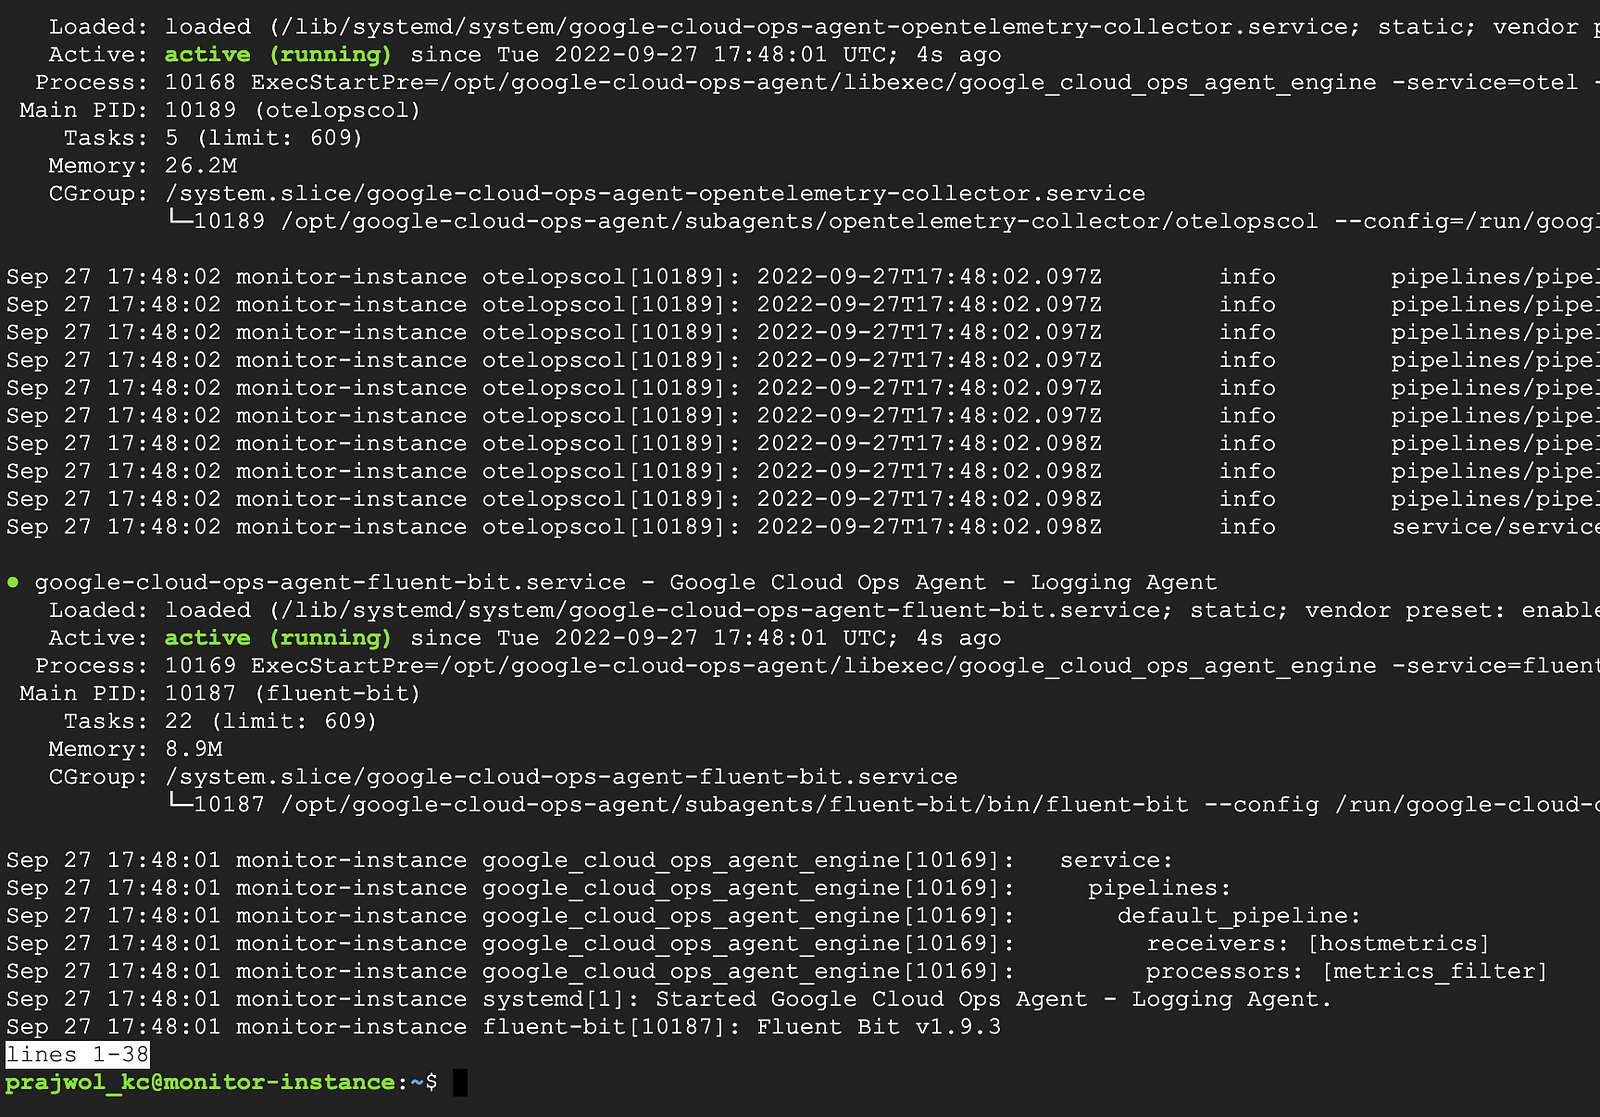
- Run the Monitoring agent install script command in the SSH terminal of VM instance to install the Cloud Monitoring agent and verify its installation.
$ curl -sSO https://dl.google.com/cloudagents/add-google-cloud-ops-agent-repo.sh
$ sudo bash add-google-cloud-ops-agent-repo.sh --also-install
$ sudo systemctl status google-cloud-ops-agent"*"
Create an uptime check
Uptime checks verify that a resource is always accessible. For practice, create an uptime check to verify VM is up.
- In the Cloud Console, in the left menu, click Uptime checks, and then click +Create Uptime Check.
- Set the following fields:
Title: Monitor Uptime Check, then click Next.
Protocol: HTTP
Resource Type: Instance
Applies to: Single, monitor-instance
Path: leave at default
Check Frequency: 1 min
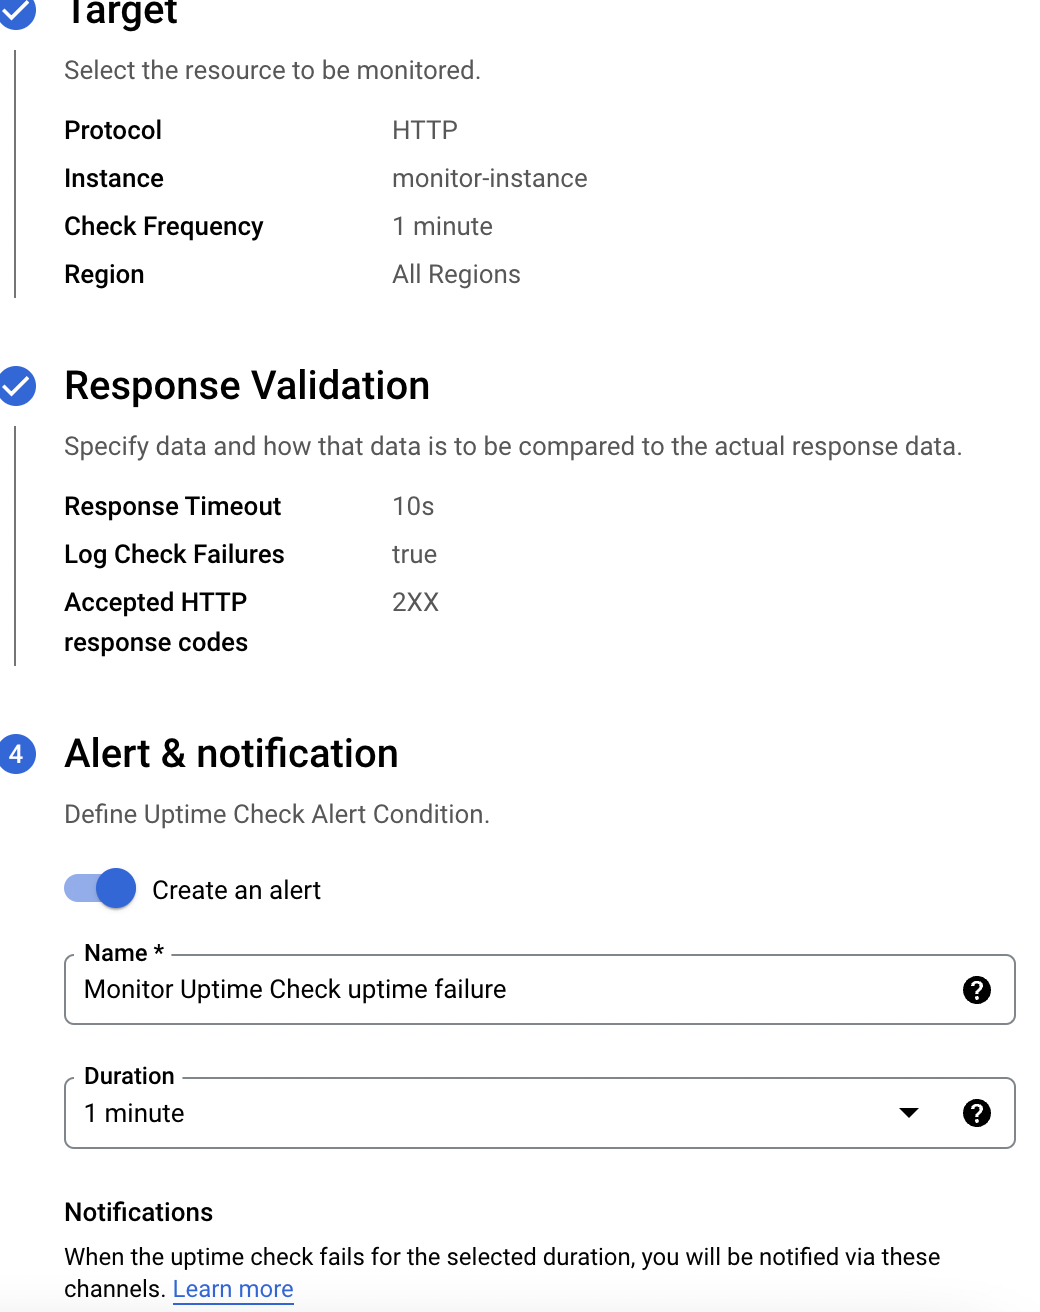
3. When we see a green check mark everything can connect. Click Create.
The uptime check that we have configured takes a while for it to become active. Continue with the lab, we will check for results later.
While we wait, create an alerting policy for a different resource.
Create an alerting policy
Use Cloud Monitoring to create one or more alerting policies.
- In the left menu, click Alerting, and then click +Create Policy.
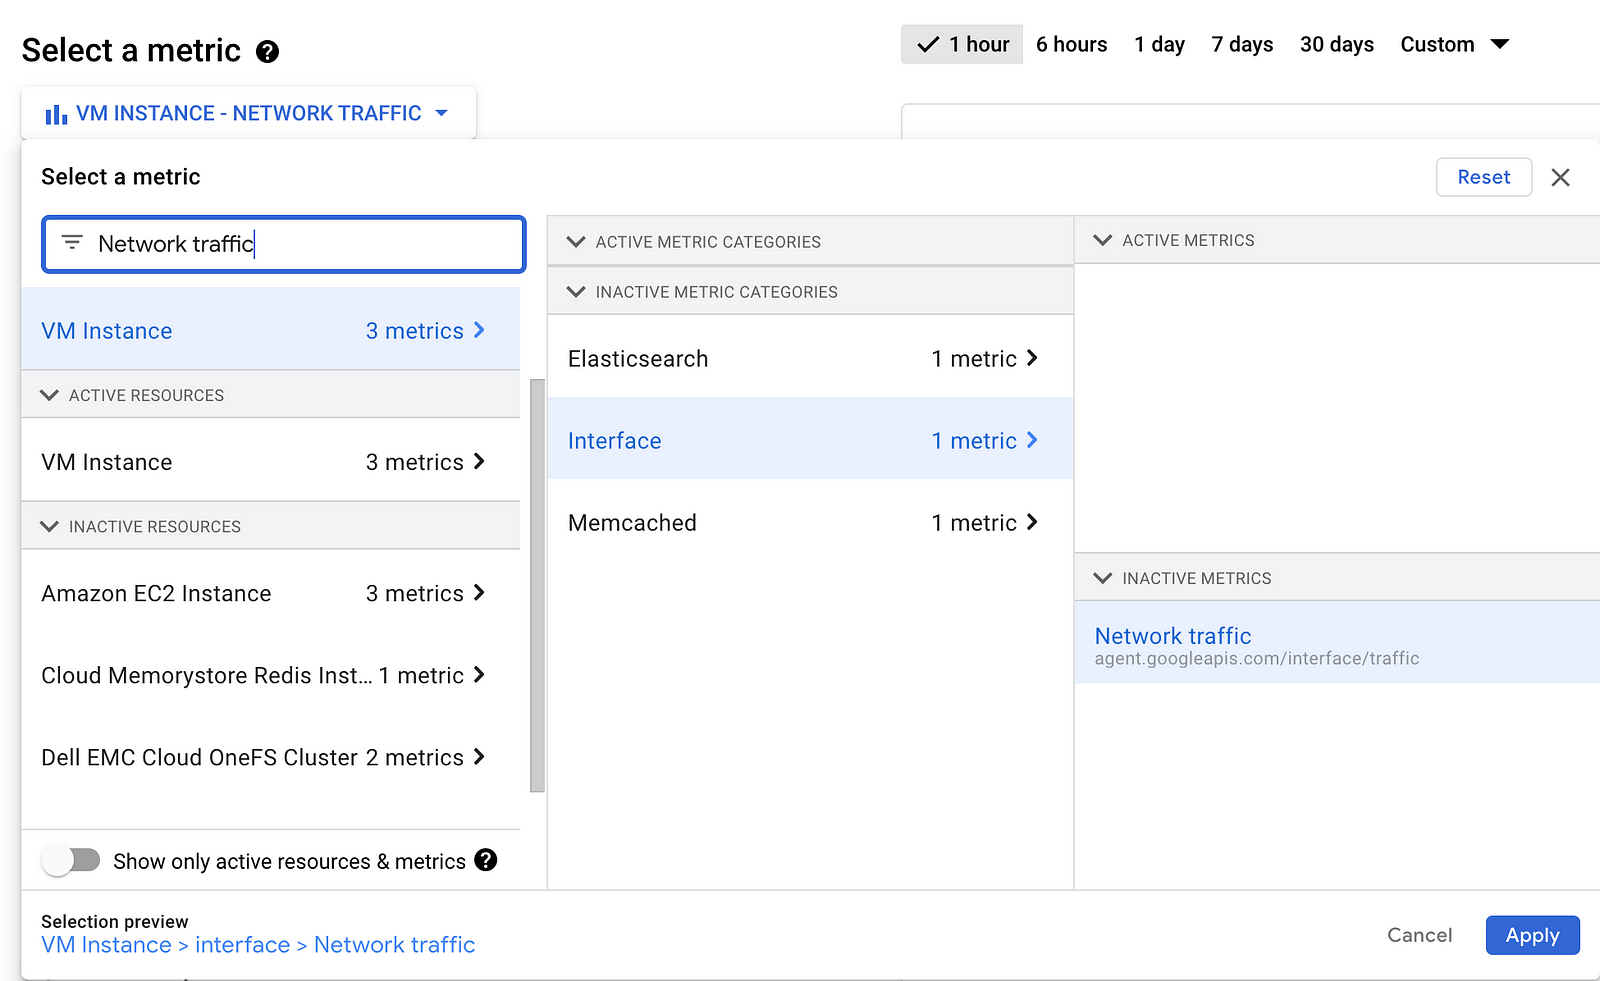
- Click on the Select a metric dropdown. Disable the Show only active resources & metrics.
- Type Network traffic in filter by resource and metric name and click on VM instance > interface. Select
Network traffic(agent.googleapis.com/interface/traffic) and click Apply. Leave all other fields at the default value.
4. Click Next.
5. Set the Threshold position to Above threshold, Threshold value to 500 and Advanced Options > Retest window to 1 min. Click Next.
6. Click on drop-down arrow next to Notification Channels, then click on Manage Notification Channels.
7. A Notification channels page will open in a new tab.
8. Scroll down the page and click on ADD NEW for Email.

9. In Create Email Channel dialog box, enter any email address in the Email Address field and a Display name.
10. Click on Save.
11. Go back to the previous Create alerting policy tab.
12. Click on Notification Channels again, then click on the Refresh icon to get the display name we mentioned in the previous step.
13. Click on Notification Channels again if necessary, select the display name and click OK.
14. Add a message in documentation, which will be included in the emailed alert.
15. Mention the Alert name as Inbound Traffic Alert.
16. Click Next.
17. Review the alert and click Create Policy.
We have created an alert! While we wait for the system to trigger an alert, create a dashboard and chart, and then check out Cloud Logging.
Create a dashboard and chart
We can display the metrics collected by Cloud Monitoring in our own charts and dashboards. We will create the charts for the lab metrics and a custom dashboard.
- In the left menu select Dashboards, and then +Create Dashboard.
- Name the dashboard
Cloud Monitoring Instance Dashboard.
Add the first chart
- Click Line option in Chart library.
- Name the chart title CPU Load.
- Click on Resource & Metric dropdown. Disable the Show-only active resources & metrics.
- Type CPU load (1m) in filter by resource and metric name and click on VM instance > Cpu. Select CPU load (1m) and click Apply. Leave all other fields at the default value. Refresh the tab to view the graph.
Check the uptime check results and triggered alerts
- In the Cloud Logging window, select Navigation menu > Monitoring > Uptime checks. This view provides a list of all active uptime checks and the status of each in different locations.
We will see Monitor Instance Uptime Check listed. Since we have just restarted our instance, the regions are in a failed status. It may take up to 5 minutes for the regions to become active. Reload our browser window as necessary until the regions are active.
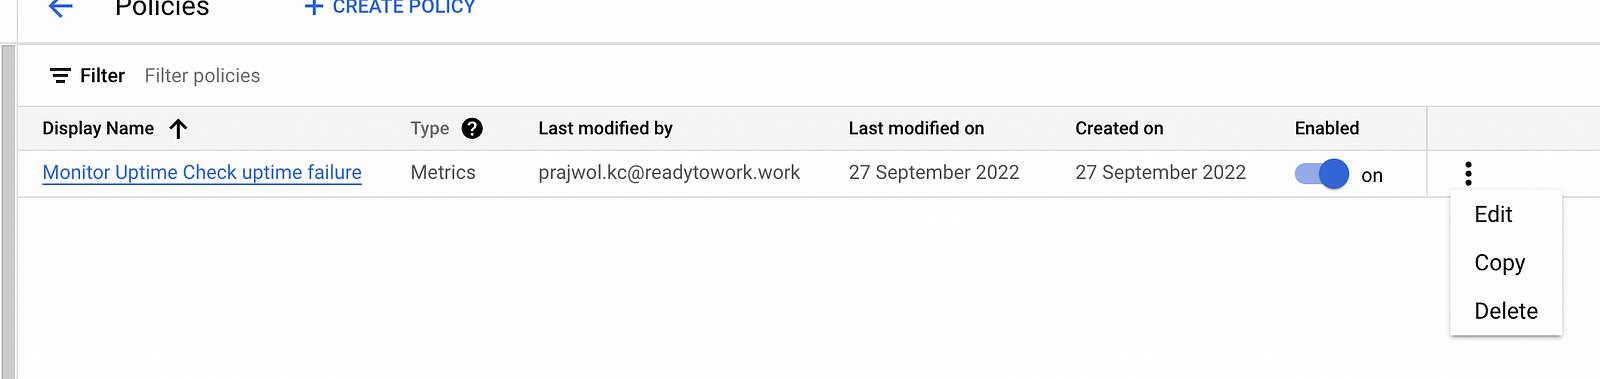
- Click the name of the uptime check,
Monitor Uptime Check.
Since we have just restarted our instance, it may take some minutes for the regions to become active. Reload browser window as necessary.
Check if alerts have been triggered
- In the left menu, click Alerting.
- We will see incidents and events listed in the Alerting window.
- Check the email account. We should see Cloud Monitoring Alerts.
Remove alerting policy
If we have set up an email alert as part of our alerting policy, there is a chance that we will receive a few emails about our resources. To avoid this, we will remove the alerting policy.
Thank you. Hope this will help to establish the cloud monitoring setup for further instances of all the GCP services.